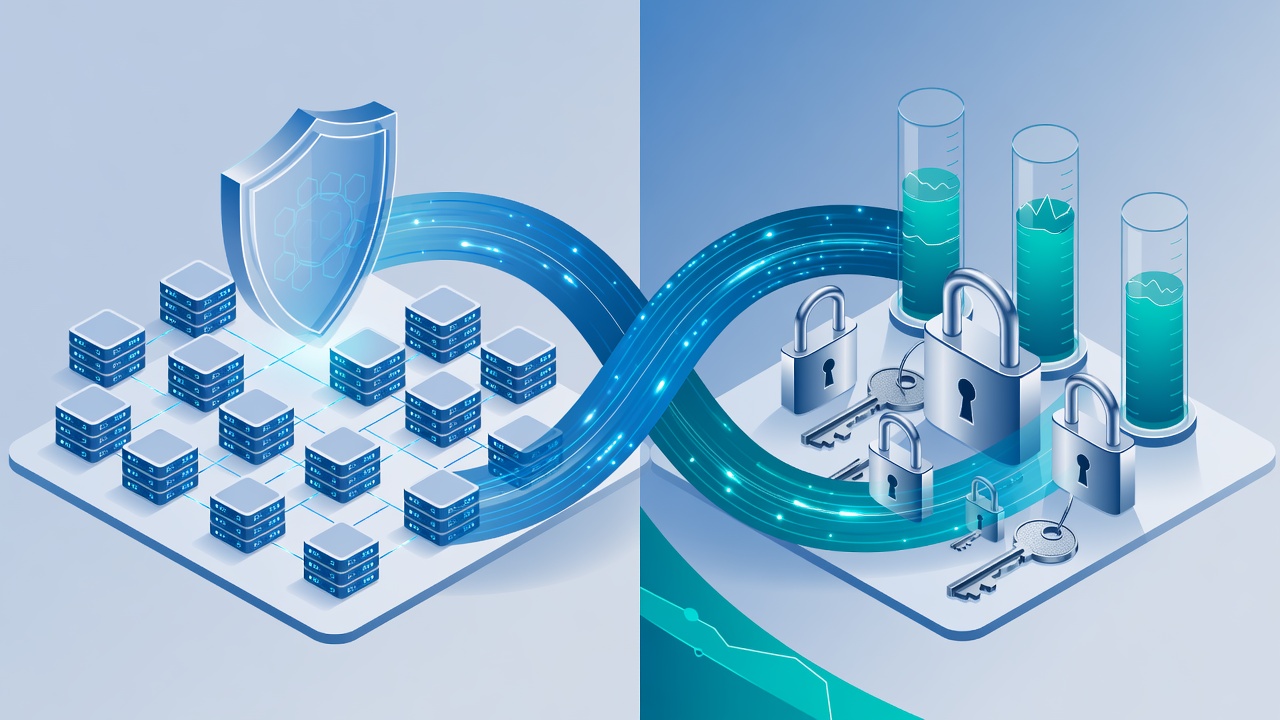
The Mechanics of Shared Responsibility Across Major Providers
Shared responsibility models define which security controls are handled by the cloud provider and which remain with the customer. AWS publishes a clear matrix on its compliance page: the provider secures the regions, availability zones, physical hardware, hypervisor, and host operating system. Customers are responsible for guest operating systems, application configuration, identity and access management, network security groups, data classification, encryption at rest and in transit, and patch management on compute instances.
Concrete example with AWS EC2: if you run an Amazon Linux 2023 instance, AWS patches the hypervisor but you must patch the Linux kernel and any installed packages using commands such as dnf update --security. For Amazon RDS PostgreSQL 15.3, AWS handles OS patching, database engine updates, backups, and high availability. The customer configures parameter groups, manages database users, enables encryption with AWS KMS, and sets up IAM database authentication.
Google Cloud follows a similar split. With Compute Engine, Google secures the underlying Borg infrastructure and the VM host. Customers manage the guest OS (for example, patching Ubuntu 22.04 LTS with apt-get update && apt-get upgrade -y), firewall rules, and application-level controls. In GKE Autopilot mode, Google manages the control plane, node OS, and Kubernetes version upgrades, while customers retain responsibility for pod security policies, network policies, and data encryption.
Azure’s model for Virtual Machines mirrors AWS EC2: Microsoft patches the host, customers patch the Windows or Linux guest. For Azure SQL Database, Microsoft operates the full stack including OS, SQL Server engine, and high availability. These distinctions directly affect engineering headcount and tooling budgets because each additional customer-managed layer requires dedicated time or automation.
The economic consequence is immediate. Operating 50 self-managed EC2 instances typically demands at least one full-time SRE or security engineer focused on OS hardening, vulnerability scanning, and log analysis. Moving the same workload to RDS, ElastiCache, or Lambda removes those responsibilities and replaces them with a predictable service fee.
Provider Incentives: Risk Limitation and Margin Expansion
Cloud providers limit legal exposure by clearly documenting customer responsibilities in service terms. In the event of a breach caused by an unpatched EC2 instance or publicly exposed S3 bucket, the provider’s liability is minimal. This risk transfer lowers the provider’s need to hold large reserves for potential litigation or regulatory fines.
A second incentive is migration pressure toward managed services. RDS, Aurora, Lambda, and DynamoDB carry higher gross margins than raw EC2 or EBS volumes. When customers realize the operational burden of patching, configuring CloudTrail, enabling GuardDuty, and maintaining WAF rules, many choose to pay the premium for managed offerings. Public earnings calls from AWS consistently highlight growth in database and analytics services that absorb security tasks.
Providers also monetize security visibility. AWS GuardDuty, Security Hub, Inspector, and Config each generate separate line items. GuardDuty pricing (as of 2024) starts at approximately $1.25 per million CloudTrail events analyzed after the first free tier, plus per-GB charges for VPC Flow Logs and DNS query logs. These fees create a self-reinforcing loop: more customer-managed resources generate more log volume, which increases the bill for security monitoring tools.
Platform builders must therefore treat security tooling costs as variable expenses that scale with architecture choices rather than fixed overhead. A data platform ingesting 2 TB of daily logs can easily incur four-figure monthly GuardDuty and Config bills if every service is left in default configuration.
Customer Economic Trade-offs: Headcount versus Service Fees
Founders face a direct substitution between personnel cost and service spend. A mid-level cloud security engineer in North America or Western Europe costs between $160,000 and $220,000 fully loaded in 2024. That single hire can manage patching, IAM hygiene, and compliance for roughly 200–300 moderately complex AWS accounts before additional headcount is required.
Contrast this with managed service fees. An RDS db.r6g.xlarge instance with multi-AZ and continuous backups typically runs $400–$600 per month depending on region. The same workload on EC2 with self-managed PostgreSQL might cost $180 in compute and storage but requires weekly patching cycles, backup scripting, and failover testing. The $300 monthly difference is easy to measure; the engineering time saved is harder to quantify yet often more valuable for early-stage teams.
Data platforms that expose customer data through APIs or marketplaces face amplified consequences. A single S3 bucket misconfiguration exposing sensitive records can destroy trust and trigger immediate churn. The expected cost of such an incident includes direct notification expenses, potential regulatory fines under GDPR or CCPA, and lost platform revenue. These tail risks push rational platform operators toward higher-priced managed services even when raw infrastructure appears cheaper.
Worked TCO Calculator for Shared Responsibility Decisions
The following Python snippet calculates comparative monthly security and operations cost between self-managed EC2-based architecture and a managed-services architecture. It uses 2024 pricing benchmarks that are publicly listed on AWS pricing pages and commonly cited in financial analyses. Adjust constants for your region and workload.
import json

def calculate_aws_tco(ec2_instances=50,
                      monthly_data_gb=5000,
                      log_events_million=120,
                      use_managed_services=True,
                      engineer_monthly_cost=14500):
    if use_managed_services:
        # RDS + Lambda + DynamoDB + GuardDuty + Security Hub
        managed_compute = ec2_instances * 420   # approx db.r6g.large equiv + Lambda
        guardduty = 85 + (log_events_million * 1.25)
        security_hub = 95
        config = monthly_data_gb * 0.003
        iam_and_kms = 45
        total_managed = managed_compute + guardduty + security_hub + config + iam_and_kms
        engineering_fraction = 0.3   # 30% of one engineer's time
        total_cost = total_managed + (engineer_monthly_cost * engineering_fraction)
        return {"architecture": "managed", "monthly_usd": round(total_cost, 0)}
    else:
        # EC2 + self-managed DB + EBS + higher engineering load
        ec2_compute = ec2_instances * 180
        ebs_storage = monthly_data_gb * 0.10
        guardduty = 85 + (log_events_million * 2.5)  # higher log volume
        inspector = 110
        engineering_fraction = 1.0   # full engineer
        total_infra = ec2_compute + ebs_storage + guardduty + inspector
        total_cost = total_infra + (engineer_monthly_cost * engineering_fraction)
        return {"architecture": "self_managed", "monthly_usd": round(total_cost, 0)}

result_managed = calculate_aws_tco(use_managed_services=True)
result_self = calculate_aws_tco(use_managed_services=False)
print(json.dumps({"managed": result_managed, "self_managed": result_self}, indent=2))
When executed with the defaults above, the managed path yields roughly $9,200 monthly while the self-managed path exceeds $22,000 once full engineering cost is included. The crossover point where managed services become cheaper occurs around 0.6–0.7 FTE security/ops effort. Teams smaller than eight engineers almost always reach positive ROI by maximizing managed services for data workloads.
Extend this model by adding variables for breach probability reduction (using public FAIR-derived loss expectancy ranges) or by pulling live pricing via the AWS Price List API. The code demonstrates that the dominant variable is almost always engineering time rather than raw infrastructure spend.
Automation Tools That Change the Cost Function
Automation narrows the economic gap between self-managed and managed architectures. Tools that enforce policy at deployment time reduce the engineering fraction required.
Terraform 1.7+ combined with Sentinel or Open Policy Agent (OPA) policies can reject deployments that violate encryption or public-access rules. A typical OPA policy checking S3 buckets looks like this:
package main

deny["S3 bucket must have encryption"] {
    input.resource.aws_s3_bucket[bucket]
    not bucket.server_side_encryption_configuration
}
Running opa eval -i tfplan.json -d policy.rego 'data.main.deny' in CI pipelines prevents non-compliant resources from reaching production. This check costs pennies per run on GitHub Actions yet avoids hours of manual review.
Trivy 0.48.0 (Aqua Security) scans both infrastructure as code and container images. The command trivy fs --exit-code 1 --severity HIGH,CRITICAL ./terraform fails builds containing known vulnerabilities. For containerized data platform components, trivy image myregistry.io/data-api:v1.2 identifies CVEs with direct links to NVD severity. Teams using Trivy weekly report 40–60% fewer runtime vulnerabilities according to publicly shared DevSecOps benchmarks.
AWS-native tools also carry explicit pricing. Security Hub costs $0.30 per month per analyzed resource after the first 10,000 free findings. Enabling it across 200 resources adds a predictable $60 line item but centralizes compliance findings from GuardDuty, Inspector, and IAM Access Analyzer. The economic value appears when a single prevented misconfiguration avoids even one hour of incident response.
Impact on Data Market and Platform Trust Economics
Data marketplaces and B2B data platforms operate under heightened sensitivity. Buyers of aggregated datasets demand proof of controls over collection, processing, and deletion. When a platform runs primarily on self-managed EC2 fleets with manual IAM, customers cannot easily verify controls at scale. Platforms that publish SOC 2 Type II reports and use managed services with clear audit trails command higher pricing and lower churn.
Observable pattern: platforms that migrated 80%+ of workloads to managed services reduced average sales cycle length by two weeks because security questionnaires receive faster, evidence-backed answers. The cost of maintaining separate evidence packs for self-managed infrastructure often exceeds the incremental service fees of RDS Aurora PostgreSQL or BigQuery.
Regulatory pressure amplifies the effect. Under GDPR Article 32, controllers must demonstrate “appropriate technical and organisational measures.” A platform using AWS-managed KMS with automatic key rotation and CloudTrail logging can reference AWS Artifact reports. A self-managed equivalent requires custom scripts, regular penetration test reports, and higher insurance premiums.
Insurance and Contractual Levers
Cyber insurance underwriters price premiums partly on cloud architecture maturity. Policies routinely ask for percentage of workloads running on managed services, use of automated vulnerability scanning, and existence of infrastructure-as-code pipelines. A platform with 70% managed services and Trivy + Terraform pipelines can see 15–25% lower premiums than an equivalent self-managed installation, according to structures published by major insurers in 2023–2024 broker reports.
Cloud provider SLAs also differ. AWS offers 99.99% availability on multi-AZ RDS but only 99.5% on single-AZ EC2 instances running self-managed databases. The credit value of SLA violations rarely compensates for actual business loss, yet the difference influences platform design. Teams internalize these incentives by routing all stateful data through managed services whose SLAs and security responsibilities align with customer contracts.
Decision Framework for Platform Teams
Evaluate each workload along four axes:
- Engineering surface area: count distinct OS versions, database engines, and logging pipelines that must be secured.
- Data sensitivity multiplier: workloads processing PII or payment data receive heavier weighting toward managed services.
- Change velocity: high-frequency deploys favor serverless or managed platforms where patching is provider responsibility.
- Cost crossover point: run the TCO model above with your actual headcount cost and projected growth.
Apply the framework to a typical customer-data ingestion pipeline. Self-managed Kafka on EC2 requires ZooKeeper management, schema registry security, client TLS certificates, and log aggregation. Amazon MSK removes ZooKeeper and manages patching, shifting the engineering load from 0.8 FTE to 0.2 FTE while adding a predictable hourly charge. Most teams find the swap economical once they exceed 15–20 topics or 100 MB/s sustained throughput.
Smaller platforms benefit from starting with maximum managed services and only introducing self-managed components when specific performance or cost thresholds are crossed. Larger platforms with dedicated security teams can sustain more self-managed infrastructure but still route sensitive data flows through services with audited compliance boundaries.
Observable Market Patterns and Long-term Equilibrium
Public financial filings and architecture diagrams of successful data platforms show a consistent pattern: heavy early adoption of managed services for core data storage and processing, selective self-management only for differentiated performance layers. Companies that began with heavy EC2 usage and later migrated report both lower security incident counts and improved gross margins once engineering time is reallocated from operations to product features.
The equilibrium price of security therefore includes both direct tooling spend and the opportunity cost of engineering time. Cloud providers have structured their responsibility boundaries to make the rational economic choice for most customers also the choice that increases provider revenue and reduces systemic risk. Understanding this alignment lets platform builders optimize rather than fight the incentives.
Concrete next step: run the TCO calculator with your current instance counts, log volumes, and fully loaded security headcount. Replace at least the stateful data tier with managed equivalents if the model shows positive ROI within nine months. Then layer automated policy enforcement with OPA or Trivy to further compress the remaining engineering fraction. This combination has proven repeatable across multiple Series B data and API platforms operating in 2023–2024.